Chiba-pref
Max |
Minimum |
Average |
|
|---|---|---|---|
| April 3 | 0.067 |
0.065 |
0.065 |
4 |
0.065 |
0.063 |
0.064 |
5 |
0.0904 |
0.0843 |
0.0876 |
6 |
0.0916 |
0.0857 |
0.0886 |
7 |
0.06 |
0.058 |
0.059 |
8 |
0.059 |
0.057 |
0.058 |
9 |
0.059 |
0.057 |
0.058 |
10 |
0.059 |
0.056 |
0.057 |
11 |
0.061 |
0.055 |
0.057 |
12 |
0.062 | 0.054 | 0.056 |
13 |
0.055 | 0.054 | 0.055 |
14 |
0.055 | 0.053 | 0.054 |
15 |
0.055 | 0.052 | 0.053 |
16 |
0.054 | 0.052 | 0.053 |
17 |
0.053 | 0.052 | 0.052 |
18 |
0.053 | 0.051 | 0.052 |
19 |
0.063 | 0.050 | 0.053 |
20 |
0.051 | 0.050 | 0.051 |
21 |
0.050 | 0.048 | 0.049 |
22 |
0.049 | 0.049 | 0.049 |
23 |
0.051 | 0.049 | 0.050 |
24 |
0.050 | 0.049 | 0.049 |
25 |
0.049 | 0.048 | 0.049 |
26 |
0.050 | 0.048 | 0.049 |
27 |
0.051 | 0.047 | 0.048 |
28 |
0.052 | 0.047 | 0.049 |
29 |
0.048 | 0.048 | 0.048 |
30 |
0.048 | ||
May 1 |
0.050 | 0.047 | 0.048 |
2 |
0.048 | 0.047 | 0.048 |
3 |
0.053 | 0.047 | 0.049 |
4 |
0.050 | 0.047 | 0.047 |
5 |
0.048 | 0.047 | 0.047 |
13 |
0.046 | 0.045 | 0.046 |
| June 11 | 0.050 | 0.045 |
(単位:マイクロシーベルト/時) |
||||||
|
日ごとの測定結果 |
|||||
|
最大値Max |
最小値minimum |
平均average |
|||
March,11日 |
0.032 |
0.022 |
0.025 |
|||
12日 |
0.024 |
0.023 |
0.023 |
|||
13日 |
0.025 |
0.023 |
0.024 |
|||
14日 |
0.024 |
0.023 |
0.023 |
|||
15日 |
0.313 |
0.023 |
0.064 |
|||
16日 |
0.141 |
0.031 |
0.052 |
|||
17日 |
0.040 |
0.036 |
0.038 |
|||
18日 |
0.036 |
0.034 |
0.035 |
|||
19日 |
0.034 |
0.033 |
0.033 |
|||
20日 |
0.034 |
0.033 |
0.033 |
|||
21日 |
0.036 |
0.030 |
0.031 |
|||
22日 |
0.098 |
0.087 |
0.090 |
|||
23日 |
0.109 |
0.096 |
0.102 |
|||
24日 |
0.102 |
0.098 |
0.100 |
|||
25日 |
0.095 |
0.092 |
0.094 |
|||
26日 |
0.089 |
0.082 |
0.085 |
|||
27 |
0.082 |
0.078 |
0.080 |
|||
28 |
0.078 |
0.075 |
0.076 |
|||
29 |
0.075 |
0.075 |
0.075 |
|||
30 |
0079 |
0.071 |
0.073 |
|||
31 |
0.079 |
0.070 |
0.072 |
|||
| April 1 | 0.071 |
0.069 |
0.071 |
|||
2 |
0.067 |
|||||
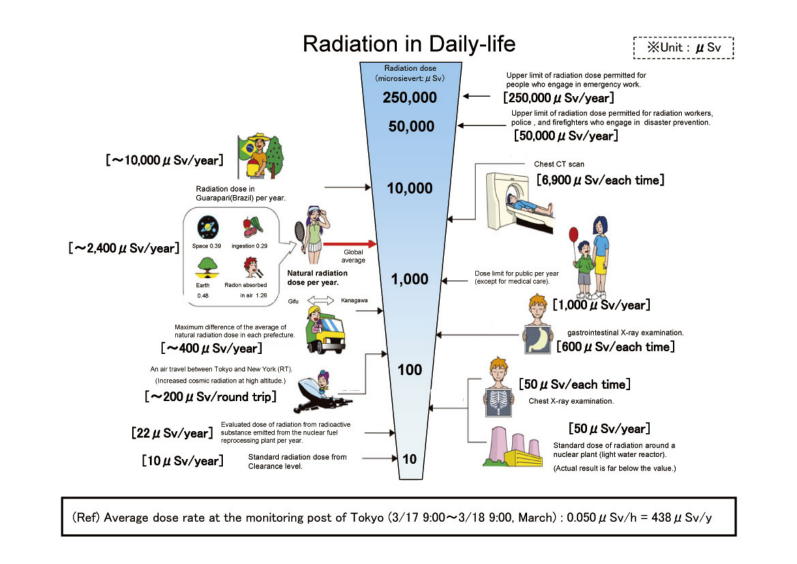
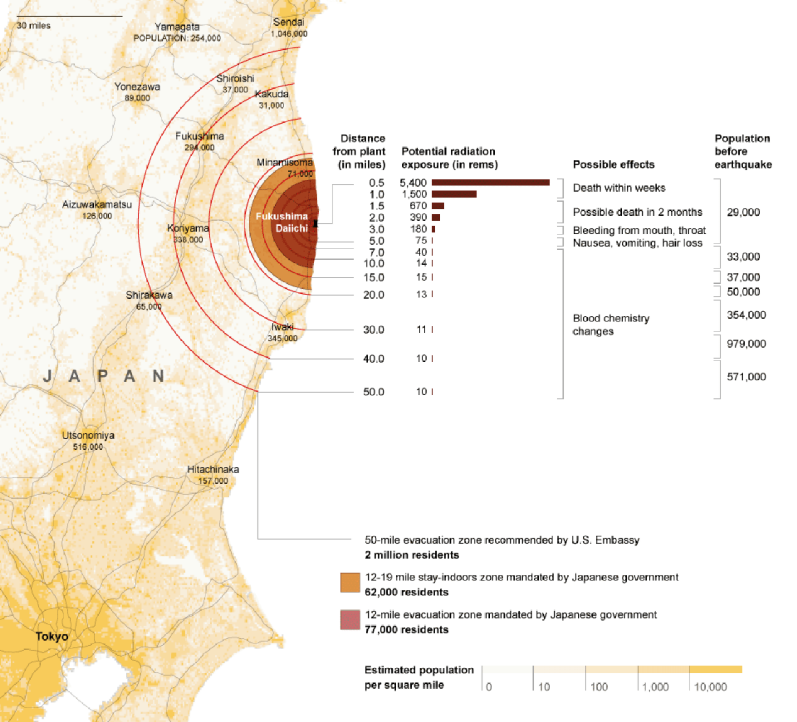
They affect human health and the environment in General, is the amount of radiation exposure over the years, 100,000 microsievert .(International Radiation ProtectionCommittee-ICRP-2007 recommendation)
TOKYOShinjuku-area
2011年 |
||||
測定日 |
線量率最大値※ Max |
線量率最小値※ minimum |
線量率平均値※ average |
|
June 11 |
10:00-10:59 | 0.0652 | 0.0596 | 0.0622 |
14 |
23:00-23:59 | 0.0655 | 0.0603 | 0.0630 |
6 |
23:00-23:59 | 0.0676 | 0.0618 | 0.0653 |
5 |
23:00-23:59 | 0.0688 | 0.0631 | 0.0651 |
4 |
23:00-23:59 | 0.0688 | 0.0631 | 0.0657 |
3 |
23:00-23:59 | 0.0708 | 0.0661 | 0.0681 |
2 |
23:00-23:59 | 0.0697 | 0.0644 | 0.0677 |
May " |
23:00-23:59 | 0.0690 | 0.0644 | 0.0688 |
30 |
23:00-23:59 | 0.0704 | 0.0657 | 0.0677 |
29 |
23:00-23:59 | 0.0696 | 0.0645 | 0.0673 |
28 |
23:00-23:59 | 0.0712 | 0.0652 | 0.0678 |
27 |
23:00-23:59 | 0.0739 | 0.0673 | 0.0704 |
26 |
23:00-23:59 | 0.0720 | 0.0669 | 0.0691 |
25 |
23:00-23:59 | 0.0712 | 0.0663 | 0.0689 |
24 |
23:00-23:59 | 0.0719 | 0.0668 | 0.0693 |
23 |
23:00-23:59 | 0.0749 | 0.0685 | 0.0714 |
22 |
23:00-23:59 | 0.0742 | 0.0691 | 0.0718 |
21 |
23:00-23:59 | 0.0742 | 0.0683 | 0.0716 |
20 |
09:00-09:9 | 0.0762 | 0.0703 | 0.0733 |
19 |
23:00-23:59 | 0.0746 | 0.0695 | 0.0721 |
18 |
00:00-00:59 | 0.0788 | 0.0722 | 0.0752 |
17 |
23:00-23:59 | 0.0781 | 0.0730 | 0.0748 |
16 |
23:00-23:59 | 0.0781 | 0.0725 | 0.0753 |
15 |
08:00-08:59 | 0.0816 | 0.0748 | 0.0782 |
14 |
23:00-23:59 | 0.0802 | 0.0736 | 0.0769 |
13 |
23:00-23:59 | 0.0802 | 0.042 | 0.0772 |
12 |
08:00-08:59 | 0.0795 |
0.0740 |
0.0774 |
11 |
09:00-09:59 | 0.0866 |
0.0798 |
0.0833 |
10 |
04:00-04:59 | 0.0853 |
0.0791 |
0.0826 |
9 |
07:00-07:59 | 0.0868 |
0.0809 |
0.0838 |
8 |
15:00-15:59 | 0.0884 |
0.0814 |
0.0849 |
7 |
02:00-02:59 | 0.0892 |
0.0836 |
0.0862 |
6 |
23:00-23:59 | 0.0902 |
0.0836 |
0.0864 |
5 |
23:00-23:59 | 0.0904 |
0.0843 |
0.0870 |
4 |
23:00-23:59 | 0.0920 |
0.0850 |
0.0885 |
3 |
23:00-23:59 | 0.0933 |
0.0876 |
0.0900 |
2 |
02:00-02:59 | 0.0977 |
0.0913 |
0.0948 |
April " |
03:00-03:59 | 0.102 |
0.0950 |
0.0979 |
31 |
03:00-03:59 | 0.104 |
0.0966 |
0.101 |
30 |
08:00-08:59 | 0.112 |
0.104 |
0.108 |
29日 |
08:00−08:59 | 0.112 |
0.105 |
0.108 |
28日 |
08:00−08:59 | 0.115 |
0.108 |
0.112 |
27日 |
09:00−09:59 | 0.12 |
0.112 |
0.116 |
26日 |
09:00−09:59 | 0.125 |
0.119 |
0.122 |
25日 |
02:00−02:59 | 0.138 |
0.131 |
0.134 |
24日 |
23:00−23:59 | 0.138 |
0.131 |
0.134 |
23日 |
09:00−09:59 | 0.149 |
0.142 |
0.146 |
22日 |
23:00−23:59 | 0.158 |
0.150 |
0.154 |
21日 |
23:00−23:59 |
0.147 |
0.137 |
0.141 |
20日 |
23:00−23:59 | 0.0515 |
0.0465 |
0.0494 |
19日 |
23:00−23:59 | 0.048 |
0.0435 |
0.0459 |
3月18日 |
0.0530 |
0.0443 |
0.0484 |
|
3月17日 |
0.0562 |
0.0460 |
0.0511 |
|
3月16日 |
0.161 |
0.0499 |
0.0719 |
|
3月15日 |
0.809 |
0.0318 |
0.109 |
|
3月14日 |
0.0377 |
0.0304 |
0.0341 |
|
3月13日 |
0.0383 |
0.0314 |
0.0343 |
|
3月12日 |
0.0384 |
0.0305 |
0.0342 |
|
3月11日 |
earthquake | 0.0376 |
0.0308 |
0.0341 |
3月10日 |
0.0372 |
0.0307 |
0.0338 |
|
3月9日 |
0.0379 |
0.0311 |
0.0343 |
|
3月8日 |
0.0388 |
0.0312 |
0.0343 |
|
3月7日 |
0.0440 |
0.0308 |
0.0366 |
|
3月6日 |
0.0377 |
0.0308 |
0.0343 |
|
3月5日 |
0.0374 |
0.0304 |
0.0339 |
|
3月4日 |
0.0375 |
0.031 |
0.0339 |
|
3月3日 |
0.0377 |
0.0304 |
0.0340 |
|
3月2日 |
0.0419 |
0.0311 |
0.0344 |
|
(march)3月1日 |
0.0461 |
0.0313 |
0.0368 |
|
| ※ 単位はμGy/h(マイクログレイ※※/時間) (μGy/h)'=(µSv/h) ※※ グレイは放射線が物質に当たった時のエネルギー量を表し、大気中の放射線量1グレイは1シーベルトに換算できます |
||||
With regard to the explosion of Fukushima Dai-ichiNuclear Power Plant, AIST has started to monitor the radiation dose in the air.The result of radiation measurement detected at AIST Tsukuba Central 1 Site isshown as follows:
*There is no leakage of the radio isotope reported in the site of AIST researchfacilities.
<Place of Monitoring> Higashi 1-1, Tsukuba,Ibaraki Prefecture
<Measurement Condition>
-Measuring instrument:Scintillation survey meter TCS-171
-Measurement Result: We deducted the background radiation (0.06µSv/h) from the original results to get announced results below.
Date |
Time |
Result (µSv/h) |
|
Balcony (3F) |
Parking area |
||
| June 10 | 10:00 | 0.08 | |
15 |
0.10 | ||
5 |
0.09 | ||
4 |
0.09 | ||
3 |
0.11 | ||
2 |
0.10 | ||
May 1 |
0.09 | ||
30 |
23:00 | 0.11 | |
29 |
23:00 | 0.09 | |
28 |
23:00 | 0.10 | 0.19 |
27 |
23:00 | 0.10 | |
26 |
23:00 | 0.09 | |
25 |
23:00 | 0.09 | |
24 |
23:00 | 0.12 | |
23 |
23:00 | 0.10 | |
22 |
23:00 | 0.09 | |
21 |
23:00 | 0.10 | (0.18) |
20 |
09:00 | 0.10 |
0.20 |
19 |
23:00 | 0.09 |
|
18 |
00:00 | 0.09 |
|
17 |
23:00 | 0.11 |
|
16 |
|||
15 |
08:00 | 0.11 |
0.21 |
14 |
09:00 | 0.12 |
0.22 |
13 |
17:00 | 0.11 |
0.20 |
12 |
08:00 | 0.12 |
0.24 |
11 |
23:00 | 0.13 |
0.24 |
10 |
04:00 | 0.13 |
|
9 |
07:00 | 0.14 |
|
8 |
15:00 | 0.13 |
0.21 |
7 |
02:00 | 0.12 |
|
6 |
09:00 | 0.14 |
0.25 |
5 |
03:00 | 0.14 |
|
4 |
17:00 | 0.12 |
0.25 |
3 |
09:00 | 0.13 |
0.26 |
2 |
03:00 | 0.15 |
|
| April 1 | 04:00 | 0.16 |
|
31 |
04:00 |
0.17 |
|
30 |
09:00 | 0.17 |
0.32 |
29 |
09:00 | 0.18 |
0.29 |
28 |
09:00 | 0.21 |
0.28 |
27 |
09:00 | 0.21 |
|
26 |
09:00 | 0.21 |
|
25 |
23:00 | 0.22 |
|
24 |
17:00 | 0.28 |
0.39 |
23 |
11:00 | 0.28 |
0.38 |
22 |
23:00 |
0.30 |
0.44 |
21 |
23:00 | 0.26 |
|
| March 20 | 09:00 | 0.04 |
|
March 19 |
09:00 |
0.04 |
|
08:00 |
0.04 |
||
07:00 |
0.04 |
||
06:00 |
0.04 |
||
05:00 |
0.04 |
||
04:00 |
0.04 |
||
03:00 |
0.04 |
||
02:00 |
0.04 |
||
01:00 |
0.04 |
||
00:00 |
0.04 |
||
March 18 |
23:00 |
0.04 |
|
22:00 |
0.04 |
||
21:00 |
0.04 |
||
20:00 |
0.04 |
||
19:00 |
0.04 |
||
18:00 |
0.05 |
||
17:00 |
0.05 |
0.10 |
|
16:00 |
0.05 |
0.09 |
|
15:00 |
0.05 |
0.09 |
|
14:00 |
0.05 |
0.07 |
|
13:00 |
0.02 |
0.08 |
|
12:00 |
0.02 |
0.09 |
|
11:00 |
0.03 |
0.09 |
|
10:00 |
0.03 |
0.08 |
|
09:00 |
0.04 |
0.08 |
|
08:00 |
0.04 |
0.08 |
|
07:00 |
0.04 |
||
06:00 |
0.05 |
||
05:00 |
0.05 |
||
04:00 |
0.05 |
||
03:00 |
0.05 |
||
02:00 |
0.05 |
||
01:00 |
0.05 |
||
00:00 |
0.05 |
||
March 17 |
23:00 |
0.05 |
|
22:00 |
0.05 |
||
21:00 |
0.05 |
||
20:00 |
0.05 |
||
19:00 |
0.05 |
||
18:00 |
0.05 |
||
17:00 |
0.09 |
||
16:00 |
0.09 |
||
15:00 |
0.10 |
||
14:00 |
0.08 |
||
13:00 |
0.09 |
||
12:00 |
0.10 |
||
11:00 |
0.10 |
||
10:00 |
0.09 |
||
09:00 |
0.10 |
||
08:00 |
0.09 |
||
March 16 |
17:00 |
0.10 |
|
16:00 |
0.12 |
||
15:00 |
0.13 |
||
14:00 |
0.12 |
||
13:00 |
0.12 |
||
12:00 |
0.14 |
||
11:00 |
0.14 |
||
09:59 |
0.33 |
||
08:59 |
0.49 |
||
08:28 |
0.60 |
||
07:59 |
0.71 |
||
March 15 |
16:49 |
0.24 |
|
15:56 |
0.24 |
||
15:17 |
0.26 |
||
14:43 |
0.19 |
||
14:10 |
0.55 |
||
13:30 |
1.54 |
||
12:50 |
0.21 |
||
12:24 |
0.26 |
||
11:59 |
0.09 |
||
11:04 |
0.11 |
||
10:10 |
0.17 |
||
09:15 |
0.31 |
||
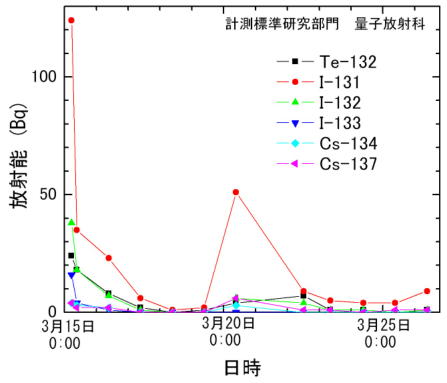
Radiation Activity Fallout Measurement
AIST measures energy spectra of the ionizing radiations from fallout using a Germanium semiconductor detector. The fallout sample is obtained by smearing on a vinyl sheet, which is the size of 1 m times1.5 m and put on the ground at AIST. The following figure shows the energy spectra of the ionizing radiation from the fallout sample (red) and background(blue). We found radionuclides of Te-132, I-131, I-132, I-133, Cs-134, andCs-137. These radionuclides are expected to be released from the nuclear powerplants at Fukushima because these are not exist in the environment.
|
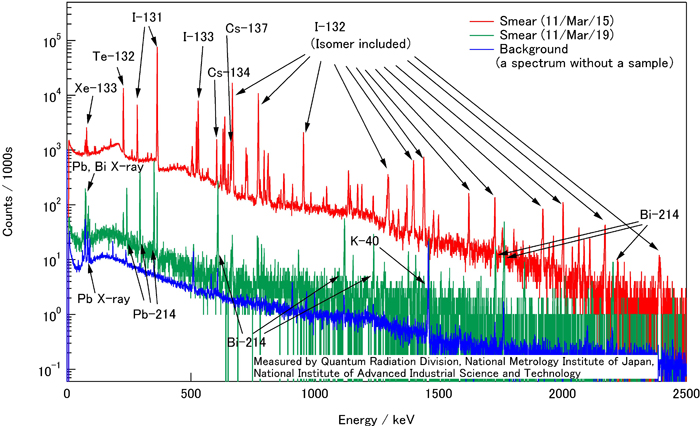 Photon energyspectra from the fallout sample smeared on the vinyl sheet on the ground(red) at 9:30 March 15, 2011, and the background (blue).
The following data show the change of the radioactivity of these radionuclides.
Radioactivity of the detected radionuclides
| 核種名 | Te-132 | I-131 | I-132 | I-133 | Cs-134 | Cs-137 |
| 半減期halflife | 3.2日 | 8.0日 | 2.3時間 | 21時間 | 2.1年 | 30年 |
| 日付 | 放射能 (Bq) | |||||
| 3月15日 9:20〜10:20 | 24 | 124 | 38 | 16 | 4 | 4 |
| 3月15日 13:20〜14:20 | 18 | 35 | 18 | 4 | 3 | 2 |
| 3月16日 13:20〜14:20 | 8 | 23 | 7 | 1 | 2 | 2 |
| 3月17日 13:20〜14:20 | 2 | 6 | 1 | 0 | 0 | 0 |
| 3月18日 13:20〜14:20 | 0 | 1 | 0 | 0 | 0 | 0 |
| 3月19日 13:20〜14:20 | 1 | 2 | 0 | 0 | 0 | 0 |
| 3月20日 13:20〜14:20 | 4 | 51 | 6 | 0 | 3 | 6 |
| 3月21日 | 雨天のため本日のデータはありません | |||||
| 3月22日 16:15〜17:15 | 7 | 9 | 4 | 0 | 0 | 1 |
| 3月23日 12:20〜13:20 | 1 | 5 | 1 | 0 | 0 | 1 |
| 3月24日 13:20〜14:20 | 1 | 4 | 1 | 0 | 0 | 0 |
| 3月25日 13:20〜14:20 | 0 | 4 | 0 | 0 | 0 | 1 |
| 3月26日 13:20〜14:20 | 1 | 9 | 1 | 0 | 0 | 1 |
| 3月27日 13:20〜14:20 | 0 | 1 | 0 | 0 | 0 | 0 |
| 3月28日 13:20〜14:20 | 0 | 1 | 0 | 0 | 0 | 0 |
| 3月29日 13:20〜14:20 | 0 | 1 | 0 | 0 | 0 | 0 |
| 3月30日 13:20〜14:20 | 1 | 5 | 0 | 0 | 8 | 13 |
| 3月31日 13:20〜14:20 | 0 | 1 | 0 | 0 | 0 | 0 |
| 4月1日 13:20〜14:20 | 0 | 1 | 0 | 0 | 0 | 0 |
| 4月2日 13:20〜14:20 | 0 | 1 | 0 | 0 | 0 | 0 |
| 4月3日 13:20〜14:20 | 0 | 0 | 0 | 0 | 0 | 0 |
| 4月4日 13:20〜14:20 | 0 | 1 | 0 | 0 | 0 | 0 |
| 4月5日 13:20〜14:20 | 0 | 0 | 0 | 0 | 0 | 0 |
6 |
0 | 0 | 0 | 0 | 0 | 0 |
7 |
0 | 0 | 0 | 0 | 0 | 1 |
8 |
0 | 2 | 0 | 0 | 1 | 2 |
3月22日、23日のデータは降雨を避けるためにサンプリング時間が変わっています。
|
Change of the radioactivity of the detected radionuclides |

|
Germanium semiconductor detector system at NMIJ |

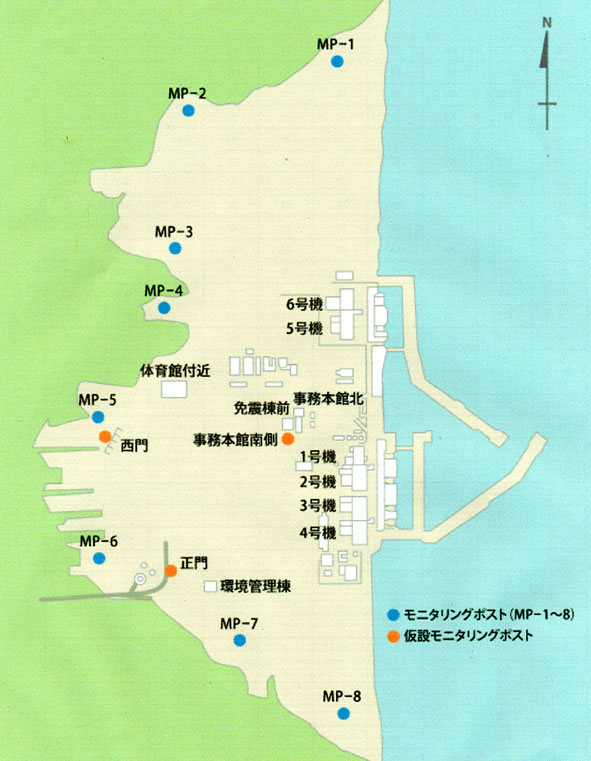
Fukushima